Plots
VineCopulas.jl does not define a plotting API yet. Since simulated observations are ordinary Julia matrices, plotting can be done with standard plotting packages.
julia
using VineCopulas
using Random
using Plots

vine = DVineCopula(
    [1, 2, 3],
    [[GaussianCopula([1.0 0.6; 0.6 1.0]), ClaytonCopula(2, 1.7)], [FrankCopula(2, 2.5)]],
)

U = rand(MersenneTwister(42), vine, 2_000)
scatter(U[1, :], U[2, :];
    xlabel="u₁", ylabel="u₂", label=false,
    title="Simulated pair from a D-vine", markersize=2, alpha=0.35)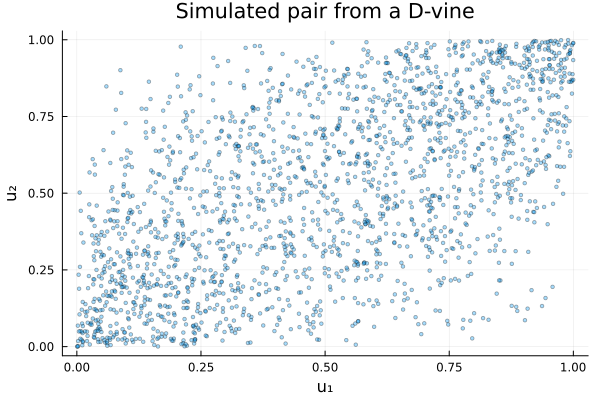
Pairwise plots are useful for visual sanity checks, but they do not replace formal model diagnostics.